OIL & GAS 5.0 (ESTATION 5.0)

Our solutions focus on providing our clients with capabilities to optimize operations at Service Stations and Plants.

Medifé

Patients and professionals within the Medifé universe have access to a Telemedicine platform that allows them to place their members at the center of the scene and provide all the services they previously received without the need for physical presence.

BANCOR

Zentricx was engaged by Bancor to carry out a project called the "Enterprise
Architecture Process (EAP)," which involved analyzing critical business challenges to
identify possible solutions that would help the organization to achieve its strategic
objectives efficiently.

Argentine Trains

Collaboration for improvements in preventive maintenance processes for rolling stock and staff safety through a “Computer Vision” solution
Learn how Computer Vision helped improve maintenance processes

Arcor

We developed a comprehensive platform (ArcorNet 2.0) designed to optimize the
communication channels between ARCOR and its sales force.

Piscina Natural

Development of a hybrid solution to detect pools in different regions

ASSISTIVE MEDICAL BOT A.N.I.T.A

Artificial Natural Intelligence & Technology Assistant

ZENPOINT

The Evolution in Document Management.

Big Data and Insurance: Towards a Risk Prediction and Prevention Industry

The entire insurance business concept is based on risk assessment. Whether it is property and casualty insurance or any other type of life, home, or auto policy, the main task is to assume the potential relevant risks for each client and predict the likelihood that the policyholder will file a claim.

How to Choose the Most Suitable Type of Graph
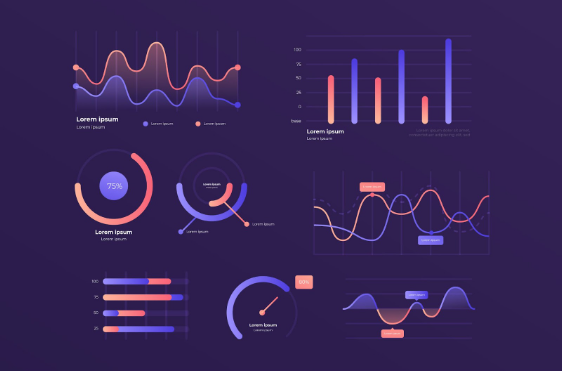
When visualizing data, it is important to consider the objective and tailor the graph to the desired storytelling. The audience for whom the results will be shown also influences the choice of graph type. The size and type of data, as well as the relationship between variables, also determine which type of graph is most suitable. It is advisable to experiment with different graphs and use multiple graphs to maintain clarity and show comparisons, trends, and relationships between variables.