

In Spain, it is estimated that around 68% of industrial companies are considered “digital novices” or “digital followers,” indicating that they have not yet fully adopted digitalization in their businesses and need to do so to improve their competitiveness. When analyzing large datasets, there is a warning about the danger of finding spurious correlations, where variables may appear to be related without any real sense or where a third variable might be influencing the results. Therefore, it is crucial to interpret data with caution, remembering that correlation does not imply causation, and to be aware of how graphs and visualizations are constructed to avoid incorrect conclusions.

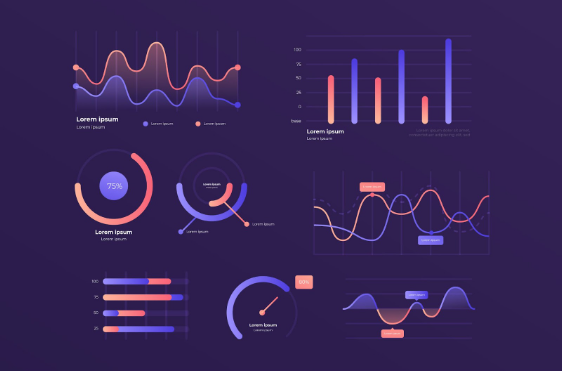
When visualizing data, it is important to consider the objective and tailor the graph to the desired storytelling. The audience for whom the results will be shown also influences the choice of graph type. The size and type of data, as well as the relationship between variables, also determine which type of graph is most suitable. It is advisable to experiment with different graphs and use multiple graphs to maintain clarity and show comparisons, trends, and relationships between variables.

Successful case in healthcare interoperability to improve healthcare services in one of the main insurance companies in Colombia, from the implementation of an interoperability solution based on the HL7 FHIR standard (Google Healthcare API) to analytical models and the use of artificial intelligence.

The rapid digital transformation of the sector exposes it more easily to attacks. Cyber resilience and robust security strategies are key to mitigating severe consequences.

Cybersecurity in the Spotlight: The Great Challenge for the Financial Sector in Spain and Latin America.

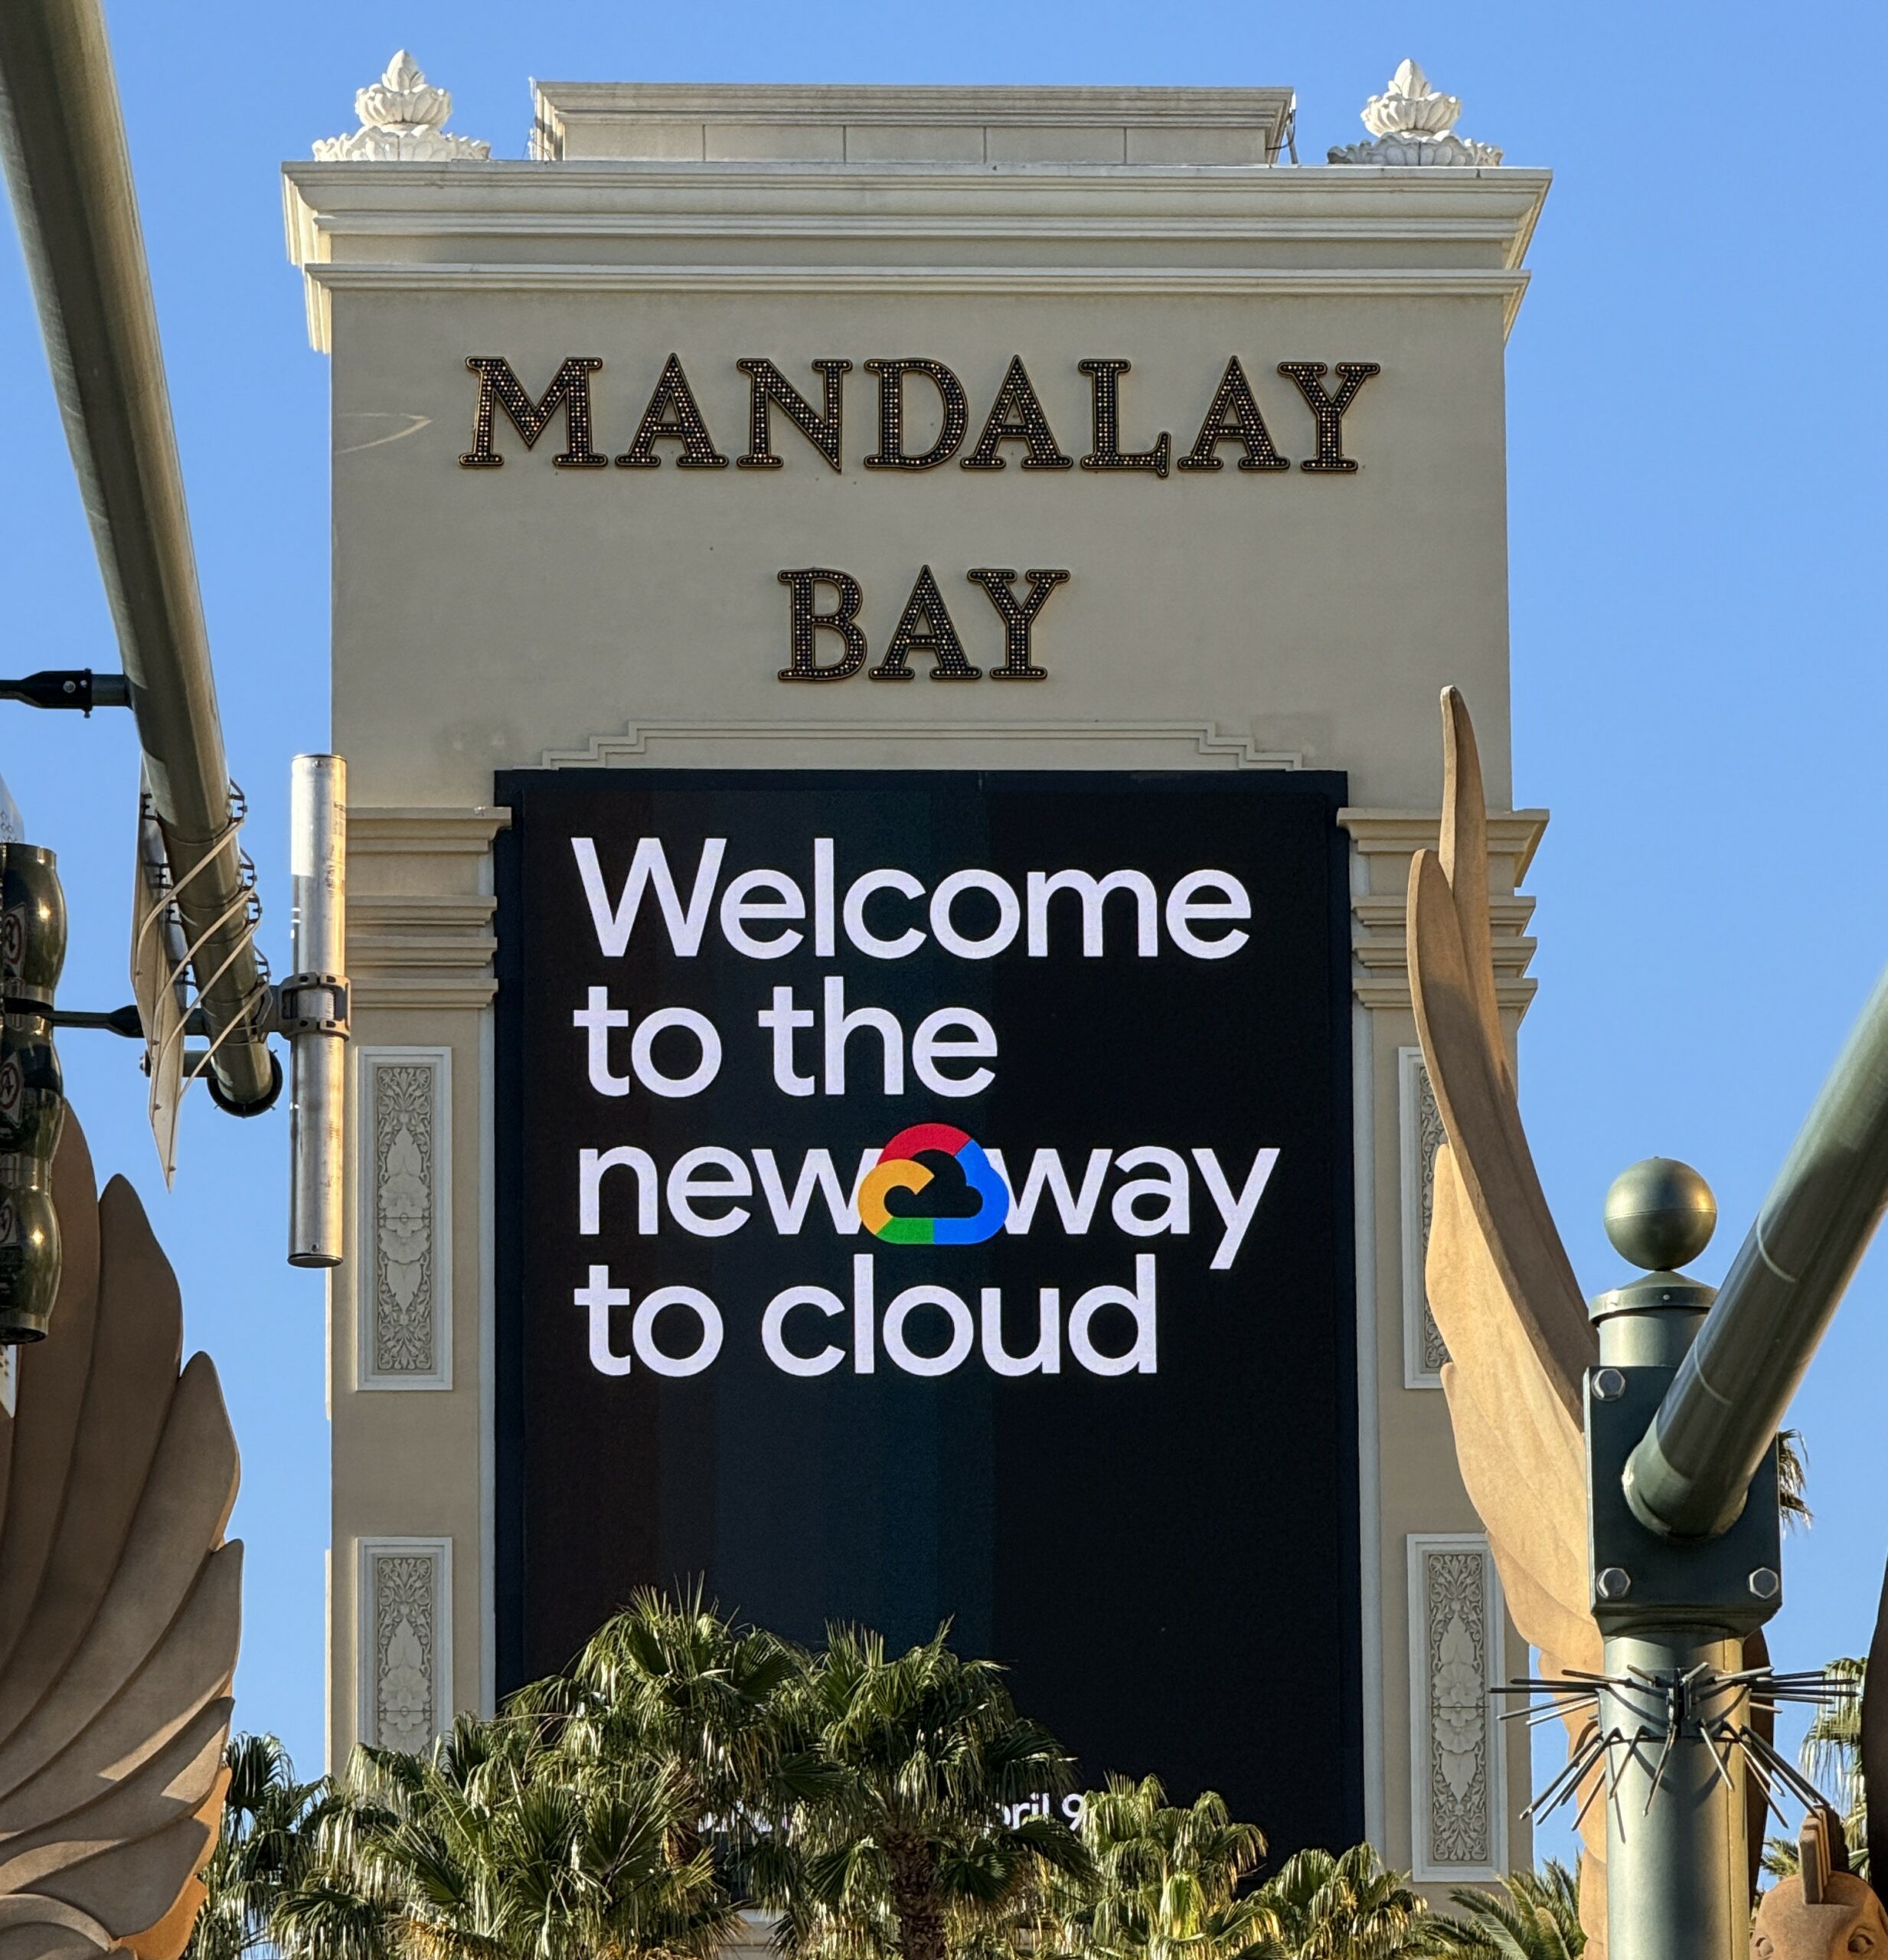
Zentricx was present at a new Google Cloud Next, which focused on the main innovations around generative AI.
Subscribe to our periodic Technology News digest.

©2023 Zentricx – All Rights Managed.